Accessing User Data
This guide includes some basic information that you can use to access user data and filter results.
Once logged in click the graph icon to access the insight dashboard.

How to use the filters
The smart filters give you the tools to analyze your users data. With the smart filters you can easily segment your users data by different criteria, so that you can get a precise list of the users that you need to work with. You can apply as many filters as you like on any of the available users fields and properties. Once added, the filters can be easily updated or removed.
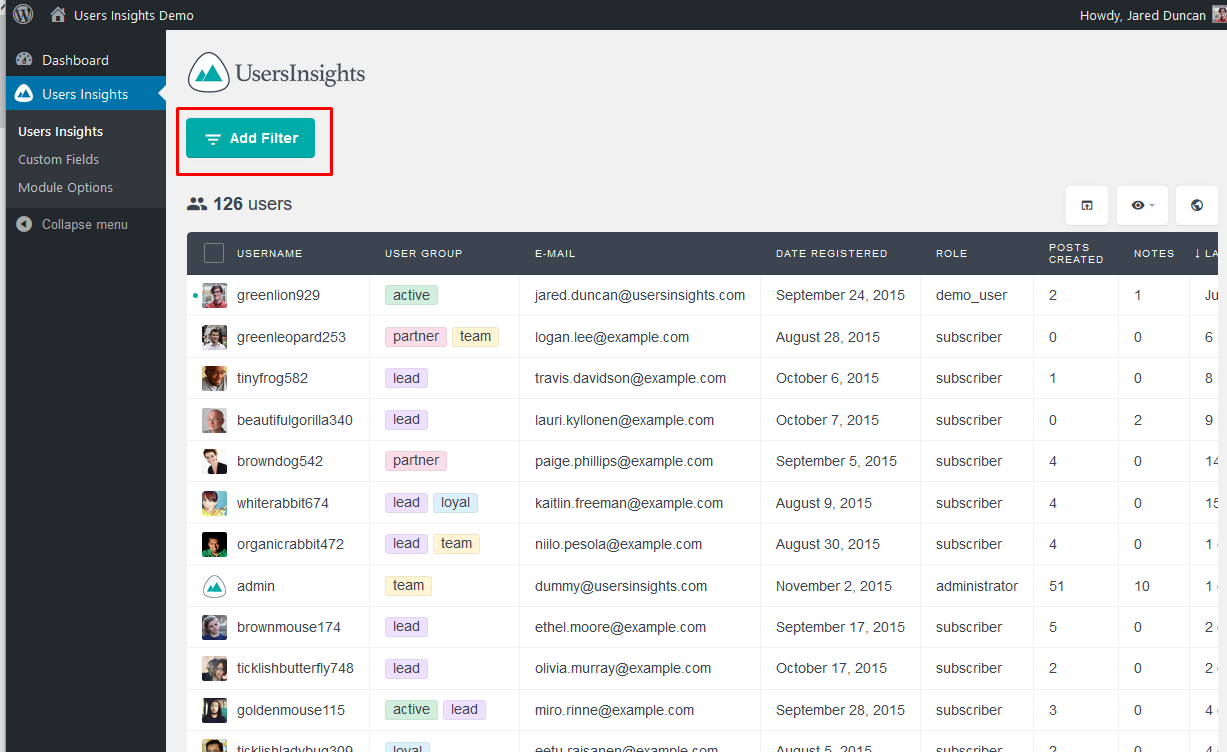
You’ll use filters to better understand all the collected data about your users. This is done in the Dashboard > Users Insights > Add filter.

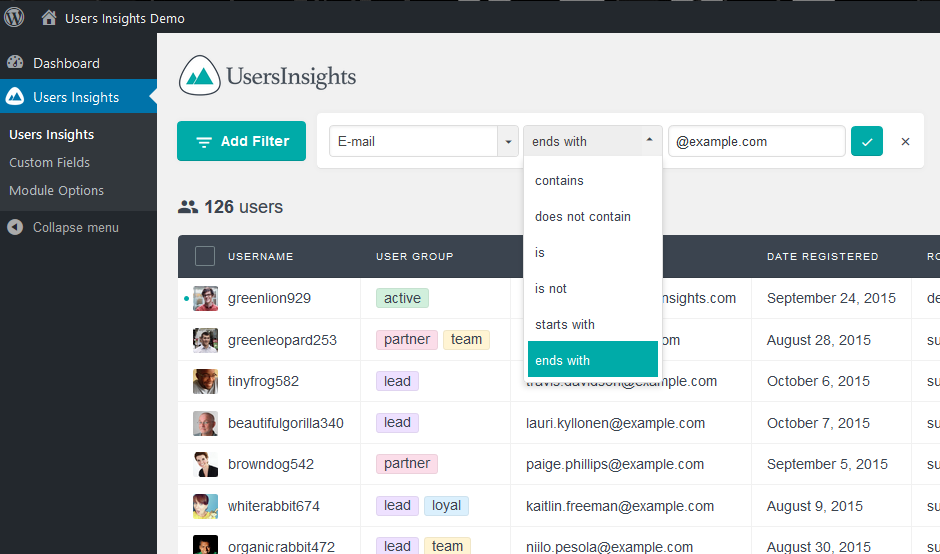
The first thing you’ll select is the column that you are using to filter. Then after you select the column you can select the filtering method, which depends on your column type. For each of the data types, some comparison methods are available.
For example, you can select all user emails that end with @example.com to see how many users you’ve got from that domain in particular:

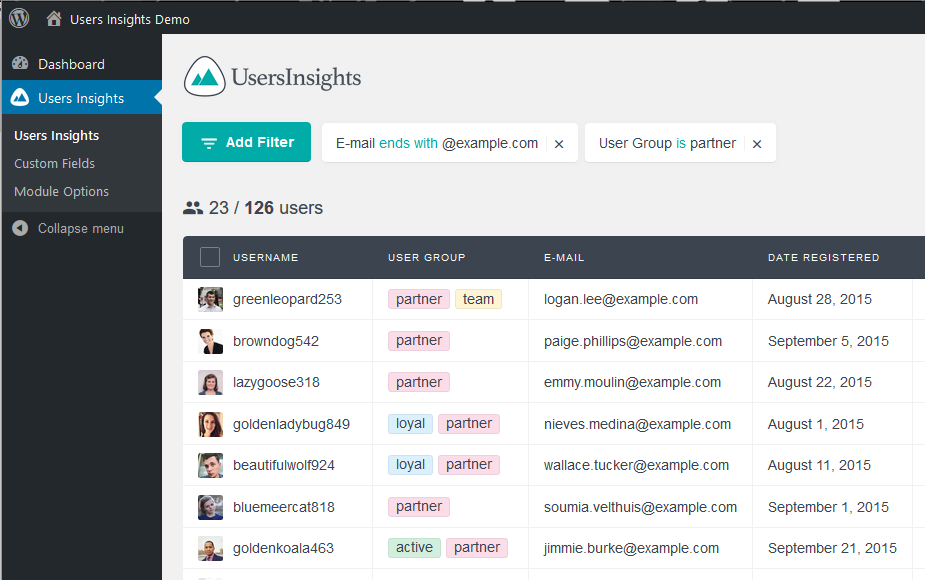
You can easily edit the filter by clicking it. Also once you have a set of results you can refine it further by using a completely different filter. In our example I’ve set 2 filters, one for the email and the second one for the user group:

How to use the table column options
Sometimes too much data can be bad for your analysis. In these cases you can easy toggle the visibility of your columns using the “Toggle Columns” button: (make HiRE User ID visible)
In that same section you can re-order your columns using the drag and drop interface that is built-in into that section: (Move Hire User ID to the first column)

Another good option to better understand your data is the sort by option. You can click the column heading and that will make your table to be ordered by that element. You can click again to revert the order in the same column and the little arrow icon shows which is the current order applied:

